Contents
- Weather in September
- Frequently asked questions
- Average temperature in September
- Average pressure in September
- Average wind speed in September
- Average humidity in September
- Average rainfall in September
- Average rainfall days in September
- Average daylight in September
- Average sunshine in September
- Average sunshine days in September
- Average UV index in September
- Average cloud cover in September
- Average visibility in September
Weather in September
Temperature
In Talca, the average high-temperature in September slightly increases from a mild 15.3°C (59.5°F) in August to a still refreshing 18.5°C (65.3°F). Contrary to the day's heat, an average low-temperature of 5.9°C (42.6°F) is recorded during the nights in September in Talca.Humidity
In September, the average relative humidity in Talca is 73%.Rainfall
In Talca, in September, it is raining for 7.4 days, with typically 37mm (1.46") of accumulated precipitation. In Talca, during the entire year, the rain falls for 66 days and collects up to 445mm (17.52") of precipitation.Daylight
In Talca, the average length of the day in September is 11h and 53min.On the first day of September, sunrise is at 07:04 and sunset at 18:27 -04. On the last day of the month, sunrise is at 07:23 and sunset at 19:49 -03.
Note: On Sunday, 08. September 2024, at 00:00, Daylight Saving Time starts, and the time zone changes from -04 to -03. Daylight Saving Time lasts until Sunday, 06. April 2025, at 00:00; consequently, the time zone reverts from -03 to -04.
Sunshine
The average sunshine in September in Talca is 8.2h.UV index
The average daily maximum UV index in September is 4. A UV Index reading of 3 to 5 represents a moderate threat to health from unprotected exposure to Sun's UV rays for ordinary individuals.Note: The average daily UV index of 4 in September transforms into the following instructions:
Act with care - Obligation to protect against skin and eye damage is highlighted. When the Sun's UV radiation is most intense during midday, it's best to find shade and limit exposure. Sun protection is enhanced with clothing that boasts a tight weave yet offers a loose fit.
Frequently asked questions
What are the temperatures in Talca in September?
What is the average humidity in September in Talca?
How much does it rain in Talca in September?
How many hours of daylight does Talca have in September?
When is the sunrise / sunset in September in Talca?
When does Daylight Saving Time (DST) start in September in Talca?
How many hours of sunshine does Talca have in September?
What is the UV index intensity in September in Talca?
Average temperature in September
Talca, Chile

- Average high temperature in September: 18.5°C
The warmest month (with the highest average high temperature) is January (31.8°C).
The month with the lowest average high temperature is July (13.3°C).
- Average low temperature in September: 5.9°C
The month with the highest average low temperature is January (13°C).
The coldest month (with the lowest average low temperature) is July (4.8°C).
Average pressure in September
Talca, Chile

- Average pressure in September: 1019.5mbar
The month with the highest atmospheric pressure is July (1020.1mbar).
The month with the lowest atmospheric pressure is February (1013.9mbar).
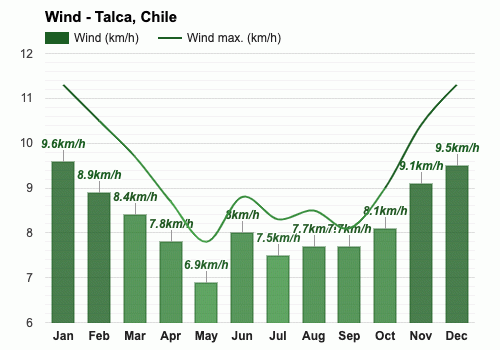
Average wind speed in September
Talca, Chile

- Average wind speed in September: 7.7km/h
The windiest month (with the highest average wind speed) is January (9.6km/h).
The calmest month (with the lowest average wind speed) is May (6.9km/h).
Average humidity in September
Talca, Chile

- Average humidity in September: 73%
The month with the highest relative humidity is July (79%).
The month with the lowest relative humidity is January (50%).
Average rainfall in September
Talca, Chile

- Average rainfall in September: 37mm
The wettest month (with the highest rainfall) is June (117mm).
The driest months (with the least rainfall) are January and February (2mm).
Average rainfall days in September
Talca, Chile

- Average rainfall days in September: 7.4 days
The month with the highest number of rainy days is July (10.6 days).
The month with the least rainy days is February (1.1 days).
Average daylight in September /
Average sunshine in September
Talca, Chile

- Average daylight in September: 11h and 5min
The month with the longest days is December (Average daylight: 14h and 30min).
The month with the shortest days is June (Average daylight: 9h and 48min).
- Average sunshine in September: 8h and 1min
The month with the most sunshine is January (Average sunshine: 11h and 30min).
The month with the least sunshine is June (Average sunshine: 7h and 30min).
Average sunshine days in September
Talca, Chile

- Average sunshine days in September: 21.7 days
The month with the most sunshine days is March (29.3 days).
The month with the least sunshine days is June (18.8 days).
Average UV index in September
Talca, Chile

- Average UV index in September: 4
The months with the highest UV index are January, February and December (UV index 6).
The months with the lowest UV index are June and July (UV index 3).
Average cloud cover in September
Talca, Chile

- Average cloud cover in September: 30
The months with the most cloud cover are June and August (Cloud cover 36).
The months with the least cloud cover are January and February (Cloud cover 7).
Average visibility in September
Talca, Chile

- Average visibility in September: 9km
The months with the highest visibility are January, February, March, April and December (10km).
The months with the lowest visibility are May, June, July, August, September, October and November (9km).
Talca, Chile
Weather forecast for your location
2. Allow the app to use your location


