Climate and monthly weather forecastLittleton, CO
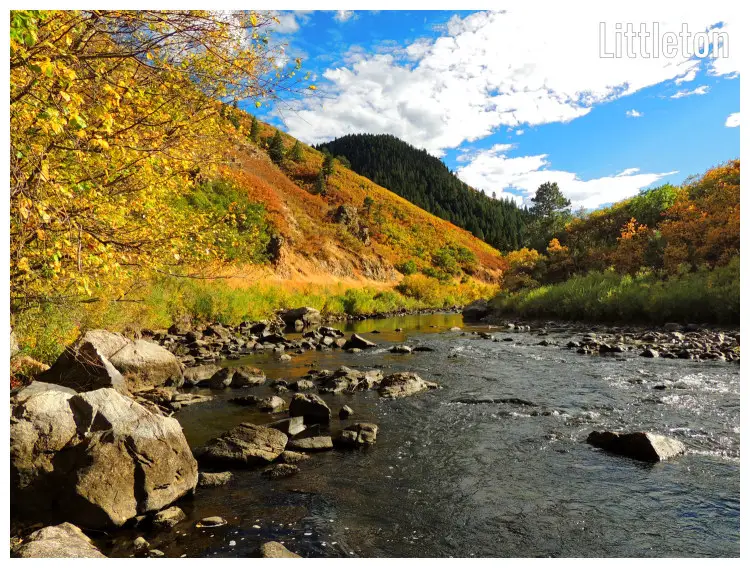
Climate and monthly weather forecast
The climate of Littleton
Nestled in the United States, Colorado state, the city of Littleton falls under the Dfb Köppen climate classification. This denotes a humid continental climate that offers no dry season paired with a warm summer. The city is marked by a clear distinction in seasonal shifts, making it interesting in terms of weather analysis.Observing the climatological data across a twelve-month span, Littleton's average maximum temperature fluctuates from 41°F (5°C) in the colder months to a peak of 86°F (30°C) during the warmest part of the year. Simultaneously, the average minimum temperatures make a departure from around 21°F (-6.1°C) in the chilling reaches of winter, to rise up to approximately 59.7°F (15.4°C) at the height of summer. A keen observer will note this temperature range reflects the diverse climatic conditions of this location.
One of the striking features of Littleton’s climate is the relative humidity that remains fairly steady throughout the year, hovering between 41% to 65%. This suggests a generally comfortable environment, rarely interrupted by extreme arid or humid conditions.
Rivering rainfall is interesting as it peaks in May with a substantial 2.05" (52mm), however, it remains relatively lower during the other months. Besides rainfall, the city also experiences snowfall in certain months, most noticeably from December to February, with a significant rise in January to a tale of 6.3" (160mm).
With daylight hours extending from 9.4 hours in the depths of December to 14.9 hours lighting up the days in the peak of June, maximizing sunlight, this location offers an ample period of daylight encompassing most of the year. Subsequently, the UV index remains moderate, peaking at 6 units from June to August.
The best time to visit Littleton
Based on a studied analysis of the climatological data, the most favorable time to visit Littleton would be between June and August. During these months, the city experiences its warmest temperatures, ranging from 82.2°F (27.9°C) to 86°F (30°C), along with moderate relative humidity. With daylight hours reaching a maximum of 14.9 hours and the UV index also hitting its peak, it is the optimum time for outdoor activities and exploration. Furthermore, these months are accompanied by lower rainfall, contributing to a dry and comfortable environment.The worst time to visit Littleton
Littleton’s least comfortable period to visit would span the months from December to February. During these months, the city experiences its lowest temperatures, dropping to averages as low as 21°F (-6.1°C), paired with longest periods of snowfall lasting up to 7 days a month. With shorter daylight hours, outdoor activities are also restricted. Moreover, the UV index hits its lowest point, further diminishing the appeal for outdoor endeavors.Spring weather in Littleton
Spring in Littleton, stretching from March to May, witnesses a gradual increase in temperatures from 52.3°F (11.3°C) to 67.5°F (19.7°C). Alongside this, the rainfall sees a marked rise culminating at 2.05" (52mm) in May. Daylight hours also start to increase, providing an extended time for activities during the day.Summer weather in Littleton
Summers in Littleton, spanning from June to August, is marked by a high-temperature variance between 82.2°F (27.9°C) to 84.7°F (29.3°C). Despite the warmth, these months manifest lower rainfall and relative humidity contributing to a less humid environment. This period sees the longest daylight hours of up to 14.9 hours and a peak UV index of 6 units, ideal for outdoor explorations.Autumn weather in Littleton
Autumn ushers in cooler weather from September to November in Littleton. During these months, temperatures dip from 77.7°F (25.4°C) to 52°F (11.1°C). Rainfall begins its gradual decline, while daylight hours also start to shorten. Despite cooler temperatures, this period offers a balanced environment for visitors.Winter weather in Littleton
Winter months from December to February in Littleton record the lowest temperatures, dipping to an average low of 21°F (-6.1°C). Alongside this, the city receives the most snowfall and the daylight hours are at their shortest. Despite these conditions, the season offers a distinct charm of its own.Weather in January
Transitioning from the coldest temps of the year, January in Littleton, Colorado, ushers in winter with average low temperatures dipping to 22.1°F (-5.5°C) and the likelihood of 3.23" (82mm) of snowfall over a span of 6.3 days. Weather in January »Weather in February
February marks a slight rise in temperature from January. With chilly highs of 41.7°F (5.4°C), even the warmer parts of the day in Littleton, Colorado carry a winter chill. Alongside the carefully decreasing temperatures, February experiences more snow, receiving about 6.3" (160mm) across 9.2 days. Weather in February »Weather in March
March ushers in the spring season in Littleton, Colorado, with average high temperatures reaching 52.3°F (11.3°C). The month often presents a blend of winter remnants and spring onset, transitioning from frosty chill to reviving warmth in the space of a month. Weather in March »Weather in April
Spring firmly establishes itself in April, owing to a noticeable increase in the temperature from March, with daily highs rising to a comfortable 58.6°F (14.8°C) in Littleton, Colorado. The increased warmth is supplemented with a rise in average rainfall, attributing to the vibrant springtime growth around the region. Weather in April »Weather in May
May is the harbinger of summer in Littleton, Colorado, with temperatures consistently hovering around high averages of 67.5°F (19.7°C) which delineates a clear shift from winter to summer. Nonetheless, the month is marked by high chances of rainfall, accumulating upto 2.05" (52mm). Weather in May »Weather in June
In June, the weather in Littleton, Colorado, transitions into full-fledged summer, characterized by the highest average temperatures of 82.2°F (27.9°C) throughout the year. However, it is not just the rising mercury levels that earmark the advent of summer. Weather in June »Weather in July
July is the hottest month of the year in Littleton, Colorado, providing peak summer conditions with average high temperatures peaking at 86°F (30°C). An increase in rainfall to 1.57" (40mm) adds a slight humidity to the warm days. Weather in July »Weather in August
August sees the continuation of summer in Littleton, Colorado, with average high temperatures dropping slightly to 84.7°F (29.3°C) from July. The last true month of summer, August celebrates warm and sunny days. Rainfall decreases rather significantly from July to August, meaning less humidity and potentially more comfortable conditions for outdoor activities. Weather in August »Weather in September
September introduces fall in Littleton, Colorado, characterized by a significant drop in temperature from August with the monthly average coming down to 77.7°F (25.4°C). The early arrival of fall brings with it cooler temperatures and shorter days. Weather in September »Weather in October
October in Littleton, Colorado, experiences a sharp turn in the weather, with cool temperatures dipping to 62.4°F (16.9°C), marking the arrival of the chilly season. A considerable decline in temperatures and daylight hours create an unmistakable semblance of the onset of winter. Weather in October »Weather in November
November solidifies the arrival of winter in Littleton, Colorado, with a noticeable chill in the air and temperatures dropping to an average high of 52°F (11.1°C). Alongside the falling temperatures, daylight hours decrease significantly to just 10 hours per day. Weather in November »Weather in December
Winter is in full swing in Littleton, Colorado, during December, marked by the year's coldest temperature of 41°F (5°C). The month is punctuated by reduced daylight hours, settling at around 9.4 hours per day. This, coupled with a modest 0.51" (13mm) of rainfall, creates an overall austere climatic condition. Weather in December »Published by: Weather Atlas | About Us
Data Sources | Weather Forecasting & Climate
Frequently asked questions
Average temperature
Littleton, CO
The warmest month (with the highest average high temperature) is July (86°F).
The month with the lowest average high temperature is December (41°F).
The month with the highest average low temperature is July (59.7°F).
The coldest month (with the lowest average low temperature) is December (21°F).
Average pressure
Littleton, CO
- Average pressure in January:
30.14"Hg - Average pressure in February:
30.07"Hg - Average pressure in March:
29.99"Hg - Average pressure in April:
29.91"Hg - Average pressure in May:
29.92"Hg - Average pressure in June:
29.92"Hg
- Average pressure in July:
30.01"Hg - Average pressure in August:
30.01"Hg - Average pressure in September:
30.01"Hg - Average pressure in October:
30.03"Hg - Average pressure in November:
30.08"Hg - Average pressure in December:
30.11"Hg
The month with the highest atmospheric pressure is January (30.14"Hg).
The month with the lowest atmospheric pressure is April (29.91"Hg).
Average wind speed
Littleton, CO
- Average wind speed in January:
6.4mph - Average wind speed in February:
6.5mph - Average wind speed in March:
6.8mph - Average wind speed in April:
7mph - Average wind speed in May:
6.3mph - Average wind speed in June:
6.5mph
- Average wind speed in July:
6.2mph - Average wind speed in August:
6.1mph - Average wind speed in September:
6mph - Average wind speed in October:
6.2mph - Average wind speed in November:
6.3mph - Average wind speed in December:
6.1mph
The windiest month (with the highest average wind speed) is April (7mph).
The calmest month (with the lowest average wind speed) is September (6mph).
Average humidity
Littleton, CO
The month with the highest relative humidity is February (65%).
The months with the lowest relative humidity are June and August (41%).
Average rainfall
Littleton, CO
- Average rainfall in January:
0.43" - Average rainfall in February:
0.79" - Average rainfall in March:
1.22" - Average rainfall in April:
1.34" - Average rainfall in May:
2.05" - Average rainfall in June:
1.18"
- Average rainfall in July:
1.57" - Average rainfall in August:
0.91" - Average rainfall in September:
0.55" - Average rainfall in October:
0.75" - Average rainfall in November:
0.59" - Average rainfall in December:
0.51"
The wettest month (with the highest rainfall) is May (2.05").
The driest month (with the least rainfall) is January (0.43").
Average rainfall days
Littleton, CO
- Average rainfall days in January:
3 days - Average rainfall days in February:
5 days - Average rainfall days in March:
8.8 days - Average rainfall days in April:
11.3 days - Average rainfall days in May:
15.8 days - Average rainfall days in June:
10.9 days
- Average rainfall days in July:
14.6 days - Average rainfall days in August:
11 days - Average rainfall days in September:
7.9 days - Average rainfall days in October:
4.8 days - Average rainfall days in November:
3.7 days - Average rainfall days in December:
4.4 days
The month with the highest number of rainy days is May (15.8 days).
The month with the least rainy days is January (3 days).
Average snowfall
Littleton, CO
The month with the highest snowfall is February (6.3").
The months with the least snowfall are June, July, August and September (0").
Average snowfall days
Littleton, CO
- Average snowfall days in January:
6.3 days - Average snowfall days in February:
9.2 days - Average snowfall days in March:
6.2 days - Average snowfall days in April:
4.9 days - Average snowfall days in May:
1.7 days - Average snowfall days in June:
0 days
- Average snowfall days in July:
0 days - Average snowfall days in August:
0 days - Average snowfall days in September:
0.1 days - Average snowfall days in October:
2.5 days - Average snowfall days in November:
4.8 days - Average snowfall days in December:
7 days
The month with the highest number of snowfall days is February (9.2 days).
The months with the least snowfall days are June, July and August (0 days).
Average daylight / Average sunshine
Littleton, CO
- Average daylight in January:
9h and 48min - Average daylight in February:
10h and 42min - Average daylight in March:
12h and 0min - Average daylight in April:
13h and 18min - Average daylight in May:
14h and 24min - Average daylight in June:
14h and 54min
- Average daylight in July:
14h and 36min - Average daylight in August:
13h and 42min - Average daylight in September:
12h and 24min - Average daylight in October:
11h and 6min - Average daylight in November:
10h and 0min - Average daylight in December:
9h and 24min
The month with the longest days is June (Average daylight: 14h and 54min).
The month with the shortest days is December (Average daylight: 9h and 24min).
- Average sunshine in January:
7h and 6min - Average sunshine in February:
6h and 48min - Average sunshine in March:
9h and 0min - Average sunshine in April:
10h and 48min - Average sunshine in May:
11h and 18min - Average sunshine in June:
11h and 48min
- Average sunshine in July:
11h and 48min - Average sunshine in August:
11h and 48min - Average sunshine in September:
11h and 6min - Average sunshine in October:
7h and 30min - Average sunshine in November:
7h and 18min - Average sunshine in December:
7h and 0min
The months with the most sunshine are June, July and August (Average sunshine: 11h and 48min).
The month with the least sunshine is February (Average sunshine: 6h and 48min).
Average sunshine days
Littleton, CO
- Average sunshine days in January:
23.2 days - Average sunshine days in February:
17.3 days - Average sunshine days in March:
17 days - Average sunshine days in April:
13.3 days - Average sunshine days in May:
11.5 days - Average sunshine days in June:
13.6 days
- Average sunshine days in July:
10 days - Average sunshine days in August:
13.3 days - Average sunshine days in September:
17.7 days - Average sunshine days in October:
22.6 days - Average sunshine days in November:
23.5 days - Average sunshine days in December:
22.3 days
The month with the most sunshine days is November (23.5 days).
The month with the least sunshine days is July (10 days).
Average UV index
Littleton, CO
The months with the highest UV index are June, July and August (UV index 6).
The months with the lowest UV index are January, February, November and December (UV index 2).
Average cloud cover
Littleton, CO
The month with the most cloud cover is April (Cloud cover 26).
The month with the least cloud cover is September (Cloud cover 14).
Average visibility
Littleton, CO
The months with the highest visibility are January, February, March, April, May, June, July, August, September, October, November and December (6mi).
The months with the lowest visibility are January, February, March, April, May, June, July, August, September, October, November and December (6mi).


