Contents
- Weather in August
- Frequently asked questions
- Average temperature in August
- Average pressure in August
- Average wind speed in August
- Average humidity in August
- Average rainfall in August
- Average rainfall days in August
- Average daylight in August
- Average sunshine in August
- Average sunshine days in August
- Average UV index in August
- Average cloud cover in August
- Average visibility in August
August
Weather in August
Temperature
August's arrival brings an average high-temperature of a still warm 26.5°C (79.7°F), slightly deviating from July's 26.4°C (79.5°F). Ubud encounters a steady low-temperature average of 21.2°C (70.2°F) throughout the month of August.Humidity
The average relative humidity in August is 84%.Rainfall
The month with the least rainfall is August, when the rain falls for 14.8 days and typically collects 23mm (0.91") of precipitation.Daylight
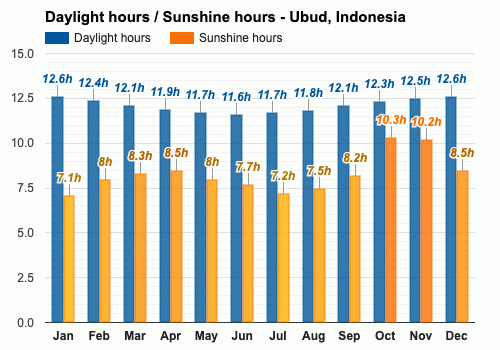
In August, the average length of the day is 11h and 50min.On the first day of August, sunrise is at 06:32 and sunset at 18:17. On the last day of the month, sunrise is at 06:20 and sunset at 18:17 WITA.
Sunshine
The average sunshine in August is 7.5h.UV index
January, May through September, with an average maximum UV index of 6, are months with the lowest UV index. A UV Index of 6 to 7 symbolizes a high health risk from exposure to the Sun's UV rays for average individuals.Note: The UV index of 6 during August leads to these advisories:
Guard against overexposure. Protection from sun-induced harm is essential. From 10 a.m. to 4 p.m., when UV radiation is at its strongest, limit direct exposure to the Sun and note that shade structures may not provide full sun protection. To cut down UV radiation exposure by about half, sport a wide-brim hat.
Published by: Weather Atlas | About Us
Data Sources | Weather Forecasting & Climate
Frequently asked questions
What are August temperatures?
What is the average humidity in August?
What is the driest month?
How much does it rain in August?
What is the average length of the day in August?
When is the sunrise / sunset in August?
How many hours of sunshine does Ubud have in August?
What is the month with the lowest UV index?
What is the UV index intensity in August?

Average temperature in August
Ubud, Indonesia
- Average high temperature in August: 26.5°C
The warmest months (with the highest average high temperature) are February, March and November (28.8°C).
The month with the lowest average high temperature is July (26.4°C).
- Average low temperature in August: 21.2°C
The month with the highest average low temperature is December (23.9°C).
The coldest month (with the lowest average low temperature) is August (21.2°C).

Average pressure in August
Ubud, Indonesia
- Average pressure in August: 1011.9mbar
The month with the highest atmospheric pressure is August (1011.9mbar).
The month with the lowest atmospheric pressure is December (1008.4mbar).

Average wind speed in August
Ubud, Indonesia
- Average wind speed in August: 9.8km/h
The windiest month (with the highest average wind speed) is July (10.1km/h).
The calmest month (with the lowest average wind speed) is March (5.9km/h).

Average humidity in August
Ubud, Indonesia
- Average humidity in August: 84%
The months with the highest relative humidity are June and July (85%).
The months with the lowest relative humidity are January and October (82%).

Average rainfall in August
Ubud, Indonesia
- Average rainfall in August: 23mm
The wettest month (with the highest rainfall) is December (147mm).
The driest month (with the least rainfall) is August (23mm).

Average rainfall days in August
Ubud, Indonesia
- Average rainfall days in August: 14.8 days
The month with the highest number of rainy days is December (26.4 days).
The month with the least rainy days is September (13.9 days).

Average daylight in August /
Average sunshine in August
Ubud, Indonesia
- Average daylight in August: 11h and 5min
The month with the longest days is December (Average daylight: 12h and 36min).
The month with the shortest days is June (Average daylight: 11h and 36min).
- Average sunshine in August: 7h and 3min
The month with the most sunshine is October (Average sunshine: 10h and 18min).
The month with the least sunshine is January (Average sunshine: 7h and 6min).

Average sunshine days in August
Ubud, Indonesia
- Average sunshine days in August: 10.2 days
The month with the most sunshine days is October (12.9 days).
The month with the least sunshine days is December (4 days).

Average UV index in August
Ubud, Indonesia
- Average UV index in August: 6
The months with the highest UV index are February, March, April, October, November and December (UV index 7).
The months with the lowest UV index are January, May, June, July, August and September (UV index 6).

Average cloud cover in August
Ubud, Indonesia
- Average cloud cover in August: 44
The month with the most cloud cover is January (Cloud cover 49).
The month with the least cloud cover is October (Cloud cover 33).

Average visibility in August
Ubud, Indonesia
- Average visibility in August: 9km
The month with the highest visibility is June (10km).
The months with the lowest visibility are January, February, March, April, May, July, August, September, October, November and December (9km).


