Contents
- The climate of Catania
- The best time to visit Catania
- The worst time to visit Catania
- Spring weather in Catania
- Summer weather in Catania
- Autumn weather in Catania
- Winter weather in Catania
- Weather in January
- Weather in February
- Weather in March
- Weather in April
- Weather in May
- Weather in June
- Weather in July
- Weather in August
- Weather in September
- Weather in October
- Weather in November
- Weather in December
- Frequently asked questions
- Average temperature
- Average pressure
- Average wind speed
- Average humidity
- Average rainfall
- Average rainfall days
- Average snowfall
- Average snowfall days
- Average sea temperature
- Average daylight
- Average sunshine
- Average sunshine days
- Average UV index
- Average cloud cover
- Average visibility

The climate of Catania
Monthly temperatures in Catania range from a low of 6.8°C (44.2°F) in colder months to a peak high of 32.2°C (90°F) in the summer. There's a notable upswing in degrees as one transits from a mild 14°C (57.2°F) in January to the warmer months peaking in July and August at over 32°C (89.6°F). Lower temperatures, typically observed between November and March, seldom dip below 8°C (46.4°F), affirming the area's relatively mild winter climate.
In terms of precipitation, Catania has a varied annual spread with rainfall levels fluctuating from as low as 5mm (0.2") in August to as much as 48mm (1.89") in October. Rainfall incidence is at its highest in October with approximately 12 days of rain, while the summer months from June to August present minimal instances of rainfall, giving way to clear, sun-filled days.
The relative humidity in Catania is generally highest in winter and autumn, reaching levels up to 73 to 75%. In contrast, the summer months mark a discernable reduction with humidity levels dipping to around 50%. The city is bathed in sunlight for between 9.6 and 14.7 hours per day, depending on the season, with maximum sunlight hours observed in June and minimum in December.
The best time to visit Catania
The worst time to visit Catania
Spring weather in Catania
Summer weather in Catania
Autumn weather in Catania
Winter weather in Catania
Weather in January
Weather in February
Weather in March
Weather in April
Weather in May
Weather in June
Weather in July
Weather in August
Weather in September
Weather in October
Weather in November
Weather in December
Frequently asked questions
What is the coldest month in Catania?
What is the most humid month in Catania?
How many days does it rain in Catania?
When does it snow in Catania?
When does it snow the most in Catania?
How many days does it snow in Catania?
What is the month with the least sunshine in Catania?
When it does not snow in Catania?
What month is the sea coldest in Catania?
When is the lowest UV index in Catania?
When are the longest days in Catania?
What are the months with the most sunshine in Catania?
What is the month with the highest UV index in Catania?
What is the warmest month in Catania?
What is the least humid month in Catania?
What is the driest month in Catania?
What month is the sea warmest in Catania?
What is the wettest month in Catania?
When is Daylight Saving Time (DST) in Catania?
What is the month with the shortest days in Catania?
Average temperature
Catania, Italy

The warmest month (with the highest average high temperature) is July (32.2°C).
The month with the lowest average high temperature is January (14°C).
The month with the highest average low temperature is August (23.5°C).
The coldest months (with the lowest average low temperature) are January and February (6.8°C).
Average pressure
Catania, Italy

- Average pressure in January:
1017mbar - Average pressure in February:
1015.1mbar - Average pressure in March:
1015.1mbar - Average pressure in April:
1014.4mbar - Average pressure in May:
1014.7mbar - Average pressure in June:
1014.6mbar
- Average pressure in July:
1014.1mbar - Average pressure in August:
1014.5mbar - Average pressure in September:
1015.7mbar - Average pressure in October:
1016.3mbar - Average pressure in November:
1015.7mbar - Average pressure in December:
1019.1mbar
The month with the highest atmospheric pressure is December (1019.1mbar).
The month with the lowest atmospheric pressure is July (1014.1mbar).
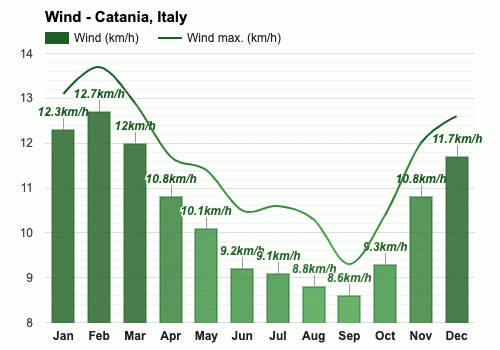
Average wind speed
Catania, Italy

- Average wind speed in January:
12.3km/h - Average wind speed in February:
12.7km/h - Average wind speed in March:
12km/h - Average wind speed in April:
10.8km/h - Average wind speed in May:
10.1km/h - Average wind speed in June:
9.2km/h
- Average wind speed in July:
9.1km/h - Average wind speed in August:
8.8km/h - Average wind speed in September:
8.6km/h - Average wind speed in October:
9.3km/h - Average wind speed in November:
10.8km/h - Average wind speed in December:
11.7km/h
The windiest month (with the highest average wind speed) is February (12.7km/h).
The calmest month (with the lowest average wind speed) is September (8.6km/h).
Average humidity
Catania, Italy

The months with the highest relative humidity are January and November (75%).
The month with the lowest relative humidity is July (50%).
Average rainfall
Catania, Italy

The wettest month (with the highest rainfall) is October (48mm).
The driest month (with the least rainfall) is August (5mm).
Average rainfall days
Catania, Italy

- Average rainfall days in January:
8.8 days - Average rainfall days in February:
7.5 days - Average rainfall days in March:
10.1 days - Average rainfall days in April:
10.3 days - Average rainfall days in May:
6.2 days - Average rainfall days in June:
4.7 days
- Average rainfall days in July:
3.5 days - Average rainfall days in August:
3.7 days - Average rainfall days in September:
9.4 days - Average rainfall days in October:
12.1 days - Average rainfall days in November:
8.1 days - Average rainfall days in December:
6.7 days
The month with the highest number of rainy days is October (12.1 days).
The month with the least rainy days is July (3.5 days).
Average snowfall
Catania, Italy

The month with the highest snowfall is January (1mm).
The months with the least snowfall are February, March, April, May, June, July, August, September, October, November and December (0mm).
Average snowfall days
Catania, Italy

- Average snowfall days in January:
0.3 days - Average snowfall days in February:
0 days - Average snowfall days in March:
0 days - Average snowfall days in April:
0 days - Average snowfall days in May:
0 days - Average snowfall days in June:
0 days
- Average snowfall days in July:
0 days - Average snowfall days in August:
0 days - Average snowfall days in September:
0 days - Average snowfall days in October:
0 days - Average snowfall days in November:
0 days - Average snowfall days in December:
0.1 days
The month with the highest number of snowfall days is January (0.3 days).
The months with the least snowfall days are February, March, April, May, June, July, August, September, October and November (0 days).
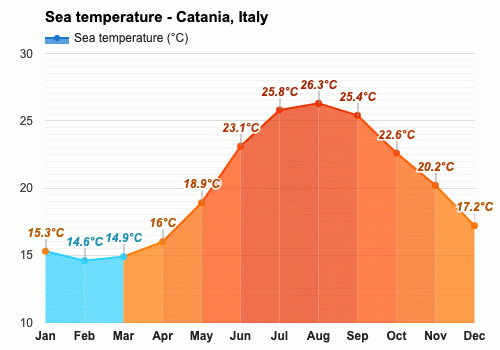
Average sea temperature
Catania, Italy

The best month for swimming (with the highest average sea temperature) is August (26.3°C).
The coldest month (with the lowest average sea temperature) is February (14.6°C).
Average daylight / Average sunshine
Catania, Italy

- Average daylight in January:
9h and 5min - Average daylight in February:
10h and 5min - Average daylight in March:
12h and 0min - Average daylight in April:
13h and 1min - Average daylight in May:
14h and 1min - Average daylight in June:
14h and 4min
- Average daylight in July:
14h and 3min - Average daylight in August:
13h and 4min - Average daylight in September:
12h and 2min - Average daylight in October:
11h and 1min - Average daylight in November:
10h and 1min - Average daylight in December:
9h and 4min
The month with the longest days is June (Average daylight: 14h and 42min).
The month with the shortest days is December (Average daylight: 9h and 36min).
- Average sunshine in January:
6h and 4min - Average sunshine in February:
6h and 4min - Average sunshine in March:
8h and 4min - Average sunshine in April:
10h and 4min - Average sunshine in May:
11h and 4min - Average sunshine in June:
12h and 1min
- Average sunshine in July:
12h and 1min - Average sunshine in August:
11h and 5min - Average sunshine in September:
10h and 5min - Average sunshine in October:
7h and 1min - Average sunshine in November:
6h and 5min - Average sunshine in December:
6h and 5min
The months with the most sunshine are June and July (Average sunshine: 12h and 6min).
The month with the least sunshine is January (Average sunshine: 6h and 36min).
Average sunshine days
Catania, Italy

- Average sunshine days in January:
19.3 days - Average sunshine days in February:
18.5 days - Average sunshine days in March:
19.2 days - Average sunshine days in April:
17.6 days - Average sunshine days in May:
21.9 days - Average sunshine days in June:
23.4 days
- Average sunshine days in July:
26.9 days - Average sunshine days in August:
24.8 days - Average sunshine days in September:
17.7 days - Average sunshine days in October:
15.6 days - Average sunshine days in November:
19.1 days - Average sunshine days in December:
21.9 days
The month with the most sunshine days is July (26.9 days).
The month with the least sunshine days is October (15.6 days).
Average UV index
Catania, Italy

The months with the highest UV index are June, July and August (UV index 7).
The months with the lowest UV index are February and December (UV index 3).
Average cloud cover
Catania, Italy

The month with the most cloud cover is January (Cloud cover 27).
The months with the least cloud cover are July and August (Cloud cover 8).
Average visibility
Catania, Italy

The months with the highest visibility are January, February, March, April, May, June, July, August, September, October, November and December (10km).
The months with the lowest visibility are January, February, March, April, May, June, July, August, September, October, November and December (10km).
Catania, Italy
Weather forecast for your location
2. Allow the app to use your location


