Weather in September
Temperature
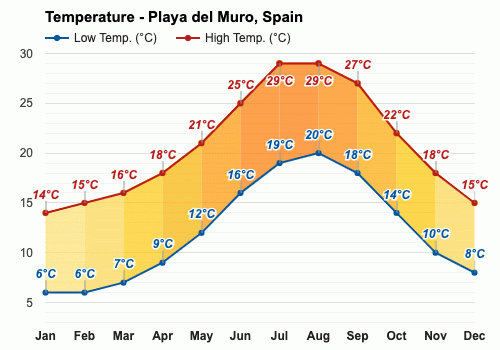
Playa del Muro records an average high-temperature of a still warm 27°C (80.6°F) in September, maintaining a close correlation with August's 29°C (84.2°F). Playa del Muro in September experiences a low-temperature average of 18°C (64.4°F).Rainfall
In Playa del Muro, in September, it is raining for 8 days, with typically 66mm (2.6") of accumulated precipitation. In Playa del Muro, during the entire year, the rain falls for 123 days and collects up to 688mm (27.09") of precipitation.Sea temperature
In September, the average sea temperature is 24°C (75.2°F).Note: Cold sensitivities vary, but with the right amount of sunshine, a gentle breeze, and a warm day, a swim in 24°C (75.2°F) waters might be just right. Remember, Olympic swimmers are used to waters between 25°C (77°F) and 28°C (82.4°F).
Daylight
In September, the average length of the day in Playa del Muro is 12h and 27min.On the first day of the month, sunrise is at 07:15 and sunset at 20:18. On the last day of September, sunrise is at 07:43 and sunset at 19:31 CEST.
Sunshine
In September, the average sunshine is 8h.UV index
In Playa del Muro, Spain, the average daily maximum UV index in September is 6. A UV Index of 6 to 7 symbolizes a high health hazard from unsafe exposure to UV radiation for the average person.Note: An average UV index of 6 in September transforms into this advice:
Act on precautions and pay attention to sun safety recommendations. Avoidance of sunburn is obligatory. The Sun's UV radiation is most potent between 10 a.m. and 4 p.m. Try to limit direct exposure to the Sun during this period. For a sun-safe wardrobe, go for clothes that are tightly woven and generously sized. Beware! Reflections from sand and water can intensify the Sun's UV radiation.
Frequently asked questions
What is the temperature in September in Playa del Muro?
How much does it rain in Playa del Muro in September?
What is the water temperature in September in Playa del Muro?
How many hours of daylight does Playa del Muro have in September?
What time are sunrise and sunset in September in Playa del Muro?
How long on average sun shines in September in Playa del Muro?
How high is the UV index in September in Playa del Muro?
Average temperature in September
Playa del Muro, Spain

- Average high temperature in September: 27°C
The warmest months (with the highest average high temperature) are July and August (29°C).
The month with the lowest average high temperature is January (14°C).
- Average low temperature in September: 18°C
The month with the highest average low temperature is August (20°C).
The coldest months (with the lowest average low temperature) are January and February (6°C).
Average rainfall in September
Playa del Muro, Spain

- Average rainfall in September: 66mm
The wettest month (with the highest rainfall) is October (104mm).
The driest month (with the least rainfall) is July (12mm).
Average rainfall days in September
Playa del Muro, Spain

- Average rainfall days in September: 8 days
The month with the highest number of rainy days is December (15 days).
The month with the least rainy days is July (4 days).
Average sea temperature in September
Playa del Muro, Spain

- Average sea temperature in September: 24°C
The best month for swimming (with the highest average sea temperature) is August (25°C).
The coldest months (with the lowest average sea temperature) are February and March (14°C).
Average daylight in September /
Average sunshine in September
Playa del Muro, Spain

- Average daylight in September: 12h and 2min
The month with the longest days is June (Average daylight: 14h and 54min).
The month with the shortest days is December (Average daylight: 9h and 24min).
- Average sunshine in September: 8h
The month with the most sunshine is July (Average sunshine: 11h).
The months with the least sunshine are January, November and December (Average sunshine: 5h).
Average UV index in September
Playa del Muro, Spain

- Average UV index in September: 6
The months with the highest UV index are June and July (UV index 9).
The months with the lowest UV index are January, November and December (UV index 2).
Playa del Muro, Spain
Weather forecast for your location
2. Allow the app to use your location


