Contents

Weather in March
Temperature
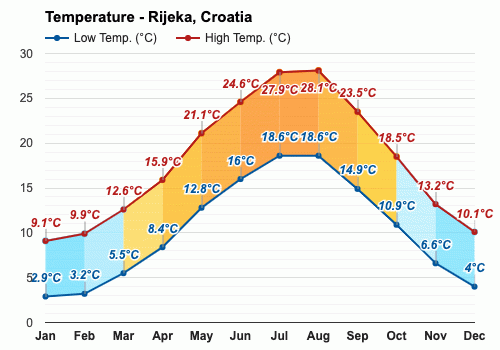
The arrival of March in Rijeka records an average high-temperature of a fresh 12.6°C (54.7°F), closely related to the 9.9°C (49.8°F) observed in February. Rijeka's temperature lowers to a mean of 5.5°C (41.9°F) during the nights in March.Humidity
The average relative humidity in March in Rijeka is 60.4%.Rainfall
In Rijeka, during March, the rain falls for 10.3 days and regularly aggregates up to 113mm (4.45") of precipitation. Throughout the year, in Rijeka, there are 130.3 rainfall days, and 1552mm (61.1") of precipitation is accumulated.Snowfall
January through March and December are months with snowfall in Rijeka. March is the last month it regularly snows. Throughout March, there are 0.2 snowfall days. Throughout the year, there are 1.4 snowfall days.Sea temperature
In Rijeka, the average seawater temperature in March is 11.3°C (52.3°F).Note: Swimming in 11.3°C (52.3°F) is deemed hazardous. Exposure to temperatures below 10°C (50°F) leads to immediate severe cold shock and hyperventilation.
Daylight
In Rijeka, the average length of the day in March is 11h and 56min.On the first day of the month, sunrise is at 06:39 and sunset at 17:49. On the last day of March, sunrise is at 05:43 and sunset at 18:29 CET.
Sunshine
In Rijeka, the average sunshine in March is 5h.UV index
The average daily maximum UV index in March is 3. A UV Index estimate of 3 to 5 represents a moderate threat to health from unprotected exposure to Sun's UV rays for ordinary individuals.Note: In March, the UV index of 3 transforms into the following advice:
Put precautions into practice - Ensuring skin and eye safety is a necessity. Avoiding direct sunlight during midday hours helps reduce the risk from intense UV radiation. Sunglasses that ward off UVA and UVB rays play a pivotal role in reducing solar eye damage. Be mindful! The reflection from snow can increase the Sun's UV radiation nearly twice.
Frequently asked questions
What are March temperatures in Rijeka?
What is the average humidity in March in Rijeka?
How much does it rain in Rijeka in March?
What is the last month it snows in Rijeka?
How cold is the water in March in Rijeka?
What is the average length of the day in March in Rijeka?
When is the sunrise / sunset in March in Rijeka?
How many hours of sunshine does Rijeka have in March?
What is the UV index intensity in March in Rijeka?
Average temperature in March
Rijeka, Croatia

- Average high temperature in March: 12.6°C
The warmest month (with the highest average high temperature) is August (28.1°C).
The month with the lowest average high temperature is January (9.1°C).
- Average low temperature in March: 5.5°C
The months with the highest average low temperature are July and August (18.6°C).
The coldest month (with the lowest average low temperature) is January (2.9°C).
Average humidity in March
Rijeka, Croatia

- Average humidity in March: 60.4%
The month with the highest relative humidity is October (67.4%).
The month with the lowest relative humidity is August (56%).
Average rainfall in March
Rijeka, Croatia

- Average rainfall in March: 113mm
The wettest month (with the highest rainfall) is October (203.9mm).
The driest month (with the least rainfall) is July (70.1mm).
Average rainfall days in March
Rijeka, Croatia

- Average rainfall days in March: 10.3 days
The month with the highest number of rainy days is April (12.6 days).
The month with the least rainy days is February (8.5 days).
Average snowfall days in March
Rijeka, Croatia

- Average snowfall days in March: 0.2 days
The month with the highest number of snowfall days is January (0.8 days).
The months with the least snowfall days are April, May, June, July, August, September, October and November (0 days).
Average sea temperature in March
Rijeka, Croatia

- Average sea temperature in March: 11.3°C
The best month for swimming (with the highest average sea temperature) is August (24.9°C).
The coldest month (with the lowest average sea temperature) is February (10.7°C).
Average daylight in March /
Average sunshine in March
Rijeka, Croatia

- Average daylight in March: 11h and 5min
The month with the longest days is June (Average daylight: 15h and 36min).
The month with the shortest days is December (Average daylight: 8h and 48min).
- Average sunshine in March: 5h and 0min
The month with the most sunshine is July (Average sunshine: 9h and 36min).
The month with the least sunshine is December (Average sunshine: 3h and 12min).
Average UV index in March
Rijeka, Croatia

- Average UV index in March: 3
The months with the highest UV index are June and July (UV index 8).
The months with the lowest UV index are January and December (UV index 1).
Rijeka, Croatia
Weather forecast for your location
2. Allow the app to use your location


